Movimento - Experimentos em Programação Criativa - 3
Essa é mais uma tentativa de reproduzir uma imagem utilizando computação criativa, puramente para aprender coisas novas e passar o tempo. Esses artigos são principalmente criados como uma forma de catalogar o processo de implementação para referencia futura quando eu estiver desenvolvendo novas coisas.
Inspiração
A imagem que tentei replicar através de código desta vez é a seguinte:
E o meu resultado é o seguinte:
Um pouco longe do resultado desejado, mas já foi muito bom para utilizar algoritmos e estruturas de dados diferentes e praticar um pouquinho com o loop de desenho do p5.
Implementação
Usarei novamento o editor do p5 para essa implementação.
Passo 1
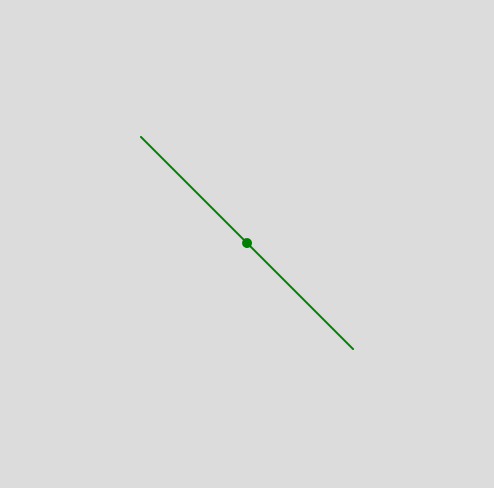
Começando por um passo que parece simples mas já precisará de um pouco e matemática, vamos tentar primeiro desenhar a linha central que fica estática. Basicamente temos um ponto no centro da imagem, com uma barra em 45º.
Como todas as barras serão movimentadas com base no seu ponto central, e terão um ângulo e comprimento diferentes, podemos criar uma função que receba a coordenada central, um ângulo e um comprimento para definir quais são as coordenadas das extremidades da linha. Assim só precisamos desenhar a linha entre os dois pontos.
Conseguimos fazer isso com a seguinte função:
1 | function calculateLinePoints(center, angle, lineSize) { |
E desenhar na tela com o método draw do p5:
1 | const SIZE = 500 |
Assim temos nossa primeira linha
Passo 2
Como as linhas terão conexão umas com as outras decidi usar classes para esse projeto. Para isso criarei uma classe para desenhar as linhas, para facilitar o trabalho.
Com um pouco de refatoração, podemos atualizar o código anterior para:
1 | function draw() { |
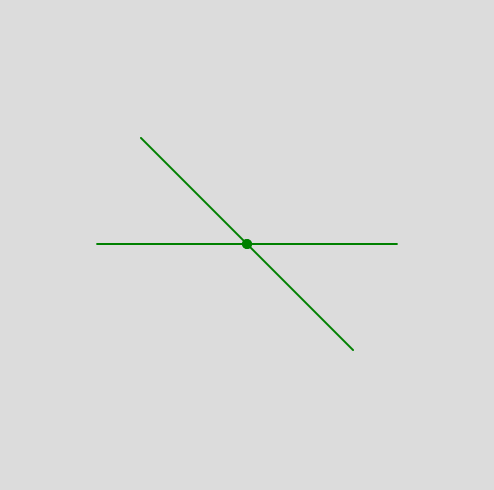
Passo 3
Podemos então adicionar um novo parâmetros para a nossa classe, para desenharmos as linhas seguintes: a linha pai.
1 | function draw() { |
Como vamos precisar que a linha ande, não podemos sempre redesenhá-la na mesma coordenada. Para isso decidi mudar nosso código para criar as réguas no método setup (que só é executado uma vez), e somente desenhá-los no método draw.
1 | const RULERS = [] |
Passo 4
Agora podemos começar com a parte de movimentação. Podemos criar uma função walk em nossa classe de linha, para movimentá-la dentro do loop de desenho. Para encontrar o próximo ponto da linha
1 | class Regua { |
E por fim chamamos o método de desenho dentro do loop:
1 | function draw() { |
Passo 5
Um novo incremento que podemos fazer em nossa linha é configurar também a velocidade em que ela se move, já que cada linha terá uma velocidade diferente.
1 | class Regua { |
E então podemos atualizar o o método setup para criar várias linhas
1 | const RULERS = [] |
Passo 6
A última linha será a responsável por adicionar o desenho na tela. Podemos ter uma propriedade para indentificarmos a linha que ela deve também desenhar a curva:
1 |
|
Na sequência criamos uma lista para os pontos da curva em que preenchemos a cada passo da régua, e chamamos uma função para desenhar a curva após desenharmos a linha:
1 |
|
Quase lá. A curva não parece tanto com uma curva.
Passo 7
Assistindo a esse vídeo de Dave Pagurek, uma forma que é apresentada para resolver esse problema é não adicionar em nossa lista de pontos da curva a extremidade atual da linha, e sim um percentual de distância entre a extremidade e o ponto anterior.
O vídeo faz um papel muito melhor em explicar esse algoritmo, mas o código simples:
1 | class Regua { |
Próximos passos
Algumas outras ideias para evoluir essa brincadeira seriam:
- Alterar a grossura da curva, quando a velocidade de desenho diminui
- Conectar a curva com a extremidade da linha, para que o desenho seja mais suave (sugestões de como implementar ambas ideias são também no vídeo mencionado acima)
Código completo
1
2
3
4
5
6
7
8
9
10
11
12
13
14
15
16
17
18
19
20
21
22
23
24
25
26
27
28
29
30
31
32
33
34
35
36
37
38
39
40
41
42
43
44
45
46
47
48
49
50
51
52
53
54
55
56
57
58
59
60
61
62
63
64
65
66
67
68
69
70
71
72
73
74
75
76
77
78
79
80
81
82
83
84
85
86
87
88
89
90
91
92
93
94
95
96
97
98
99
100
101
102
103
104
105
106
107
108
109
110
111
112
113
114
115
116
117
118
119
120
121
122
123
124
125
126
127
128
129
130
131
132
133
134
135
136
137const SIZE = 500
const RULERS = []
const RULER_COUNT = 6
function setup() {
createCanvas(SIZE, SIZE)
const base = new Regua({ x: width / 2, y: height / 2, }, 45, 300)
RULERS.push(base)
for (let i = 0; i < RULER_COUNT - 1; i++) {
const parent = RULERS[RULERS.length - 1]
const angle = random(0,180)
const length = random(50, SIZE/2)
const velocity = random(0.3, 1.5)
const shouldDrawCurve = i === RULER_COUNT - 2
const r = new Regua(base.coord, angle, length, parent, velocity, shouldDrawCurve)
RULERS.push(r)
}
}
function draw() {
  background(220)

  RULERS.forEach(ruler => {
    ruler.draw()
    ruler.walk()
  })
}
class Regua {
constructor(coord, angle, length, parent, velocity = 1, shouldDrawCurve = false) {
this.coord = coord
this.angle = angle
this.length = length
this.parent = parent
this.velocity = velocity
this.shouldDrawCurve = shouldDrawCurve
this.curvePath = []
}
draw() {
stroke('green')
strokeWeight(10)
point(this.coord.x, this.coord.y)
const [point1, point2] = this.calculateLinePoints(this.coord, this.angle, this.length)
strokeWeight(2)
line(point1.x, point1.y, point2.x, point2.y)
if (this.shouldDrawCurve) {
this.drawCurve()
}
}
walk() {
if (!this.parent) return
// Selecionar as extremidades da linha pai
const [point1, point2] = this.calculateLinePoints(this.parent.coord, this.parent.angle, this.parent.length)
const v = frameCount * this.velocity
// Calcular qual percentual da linha pai será o próximo ponto a seguir. Utilizamos o resto da divisão entre o número de loops e o dobro do tamanho do pai, e mapeamos para que a linha ande nas duas direções
const percent = map(v % this.parent.length * 2, 0, this.parent.length, -100, 0)
// Atualizar a coordenada
this.coord = this.getPointOnLine(point1, point2, Math.abs(percent))
if (this.shouldDrawCurve) {
const [point1] = this.calculateLinePoints(this.coord, this.angle, this.length)
const lastPoint = this.curvePath[this.curvePath.length - 1]
if (!lastPoint) {
this.curvePath.push(point1)
return
}
const point = createVector(lastPoint.x, lastPoint.y).lerp(createVector(point1.x, point1.y), 0.1)
this.curvePath.push({ x: point.x, y: point.y })
}
}
drawCurve() {
noFill()
stroke('black')
strokeWeight(2)
beginShape()
this.curvePath.forEach((coord) => {
curveVertex(coord.x, coord.y)
})
endShape()
}
calculateLinePoints(center, angle, lineSize) {
// Converter o angulo de graus para radianos
const angleInRadians = (angle * Math.PI) / 180
// Calcular a metade da linha
const halfLineSize = lineSize / 2
// Calcular os componentes x e y da linha
const xComponent = Math.cos(angleInRadians) * halfLineSize
const yComponent = Math.sin(angleInRadians) * halfLineSize
// Calcular os outros dois pontos da linha
const point1 = {
x: center.x - xComponent,
y: center.y - yComponent
}
const point2 = {
x: center.x + xComponent,
y: center.y + yComponent
}
return [point1, point2]
}
getPointOnLine(coordinate1, coordinate2, percent) {
// Calcular diferença entre coordenadas x e y
const dx = coordinate2.x - coordinate1.x;
const dy = coordinate2.y - coordinate1.y;
// Calcular o ponto na linha com base no percentual
const point = {
x: coordinate1.x + (dx * percent) / 100,
y: coordinate1.y + (dy * percent) / 100
};
return point;
}
}